
Power Struggle: How High Energy Burdens Harm Families in the Deep South
February 25th, 2026
Dr. Regina Moorer, Sr. Policy Analyst
For many households, keeping a home cool in the summer and warm in the winter has become a difficult trade-off rather than a basic expectation. More frequent extreme weather and rising costs for food, energy, and other necessities are forcing low-income families into a familiar heat-or-eat dilemma. Research finds that families often skip meals or delay medical care to cover energy bills, and some households endure unsafe temperatures to stretch limited budgets in high-burden regions.[1] Improving home efficiency requires upfront resources most households lack, while skipping utility payments risks shutoffs and unsafe living conditions. Families are left to make impossible choices just to get through the month. These pressures are not evenly experienced. Regional ecologies, defined by the environmental, social, and economic conditions of a place, play a significant role in shaping the level and nature of energy burdens.[2] Deep South communities experience more intense and persistent energy affordability challenges, which is closely tied to long-standing economic hardship and aging housing conditions, resulting in some of the highest energy burdens in the country.
This blog uses the Low-Income Energy Affordability Data (LEAD) Tool[3] from the Department of Energy to assess how the Deep South compares with the rest of the country in terms of energy burden.[4] This analysis focuses on HOPE’s six-state footprint, where energy burdens are among the highest in the nation and closely intersect with persistent poverty and aging housing stock.[5] The findings highlight how closely energy affordability is tied to income, housing quality, and long-standing disinvestment, underscoring the need for place-based strategies that support household stability and economic mobility. By examining conditions across these states, the blog connects national data to the lived realities of households in the communities HOPE serves.
Defining Energy Burden
Researchers began using the term energy burden in the late twentieth century to describe the distribution of energy costs across income groups. Early studies found that low-income households consistently face higher energy burdens than higher-income counterparts, even when they use less energy.[6] This work linked elevated burdens to inefficient housing, limited access to energy-saving technologies, and stagnant incomes. Today, the U.S. Department of Energy defines a high energy burden as home energy costs above 6 percent of a household’s gross annual income and energy costs above 10 percent of a household’s gross annual income as severe. [7] The LEAD Tool bases the income parameters on area median income: households earning less than 30 percent of the area median income are considered extremely low-income, and households earning up to 60 percent of the area median income are defined as low-income.
Energy Burdens for Extremely Low-Income Households in the Deep South
Nationally, extremely low-income households face disproportionately high energy burdens, averaging about 14 percent of household income.[8] LEAD data show that extremely low-income households across HOPE’s footprint face energy burdens far above the national average. In Mississippi, extremely low-income households spend about 25 percent of their income on energy, followed by Alabama and Louisiana at 23 percent, Arkansas at 22 percent, Tennessee at 19 percent, and Georgia at 18 percent. These figures confirm that every state in the region exceeds the national benchmark. Figures 1 and 2 show the energy burden for extremely low-income households across the Southeast.
Figure 1. Average Residential Energy Burden for Extremely Low-Income Households by State, Percent of Household Income Spent on Energy
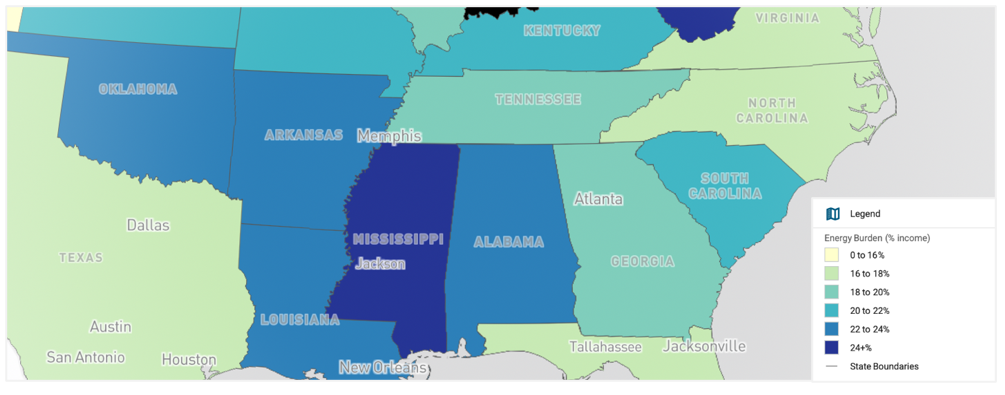
Figure 2. Extremely Low-Income Households Face Energy Burdens Above the National Average
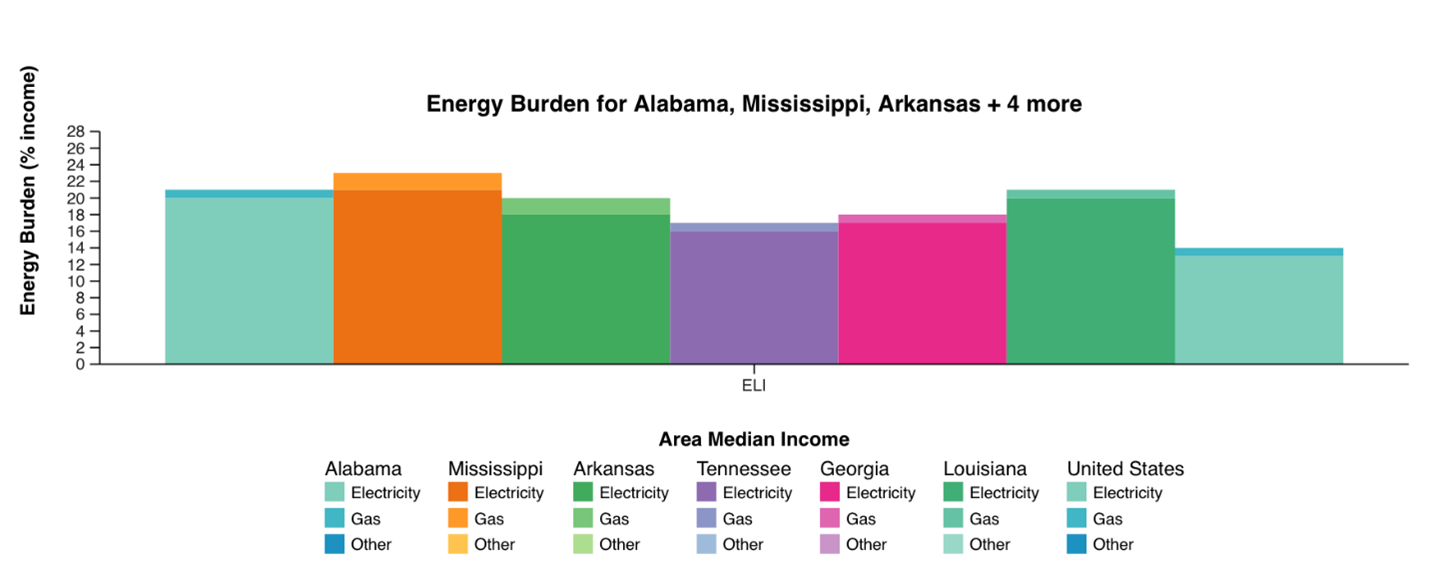
The map in Figure 1 highlights the severity of the energy burden. The chart in Figure 2 breaks down the factors that drive that burden. Together, they highlight the severity of energy affordability challenges in the Deep South. In addition to showing higher energy burdens for low-income households in the Deep South relative to similar households nationally, Figure 2 also shows that electricity accounts for the largest share of household energy costs.[9] Even modest differences in annual energy costs translate into severe financial strain for households with very low incomes, underscoring that energy burden is driven by income, housing conditions, and place rather than excessive energy use.
Energy Burden for Low-Income Households in the Deep South.
According to LEAD, low-income households nationwide spend approximately 6 percent of their income on energy. This is twice the rate for non-low-income households, which is estimated at 3 percent. Households earning up to 60 percent of the area median income are considered low-income, for the purposes of the LEAD tool and this analysis. Among low-income households, energy burdens across HOPE’s footprint are above the national average (See Figure 3). Mississippi reports the highest burden at 12 percent, followed by Alabama, Arkansas, and Louisiana at 11 percent. Tennessee has an average energy burden of 9 percent, while Georgia reports an 8 percent energy burden.
Figure 3. Average Residential Energy Burden for Low-Income Households by State, Percent of Household Income Spent on Energy
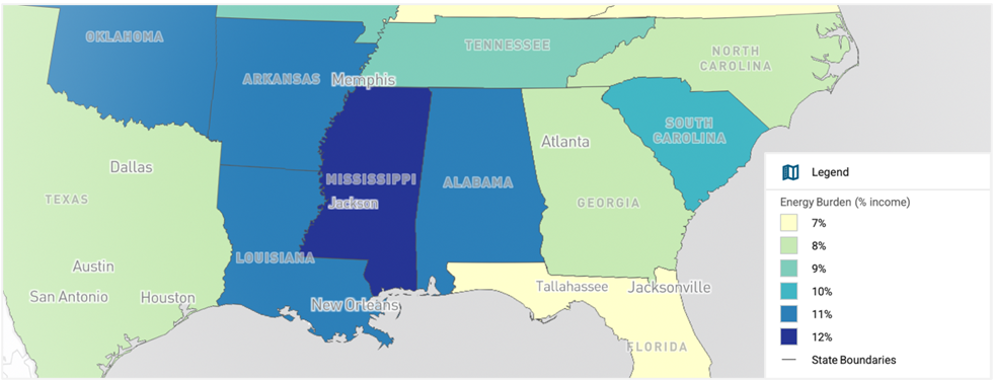
Figure 4. Low-Income Households Also Face Energy Burdens Above the National Average
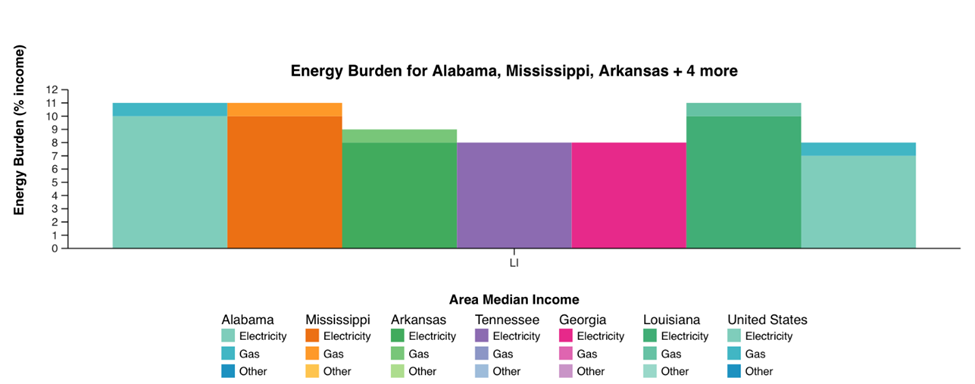
The data in Figure 4 reflect that low-income households in Alabama, Mississippi, and Louisiana face higher energy burdens than similar households nationally, while those in Georgia and Tennessee are roughly on par with national trends. The map in Figure 3 shows the total energy burden by state, combining electricity, gas, and other fuels into a single metric, whereas the chart in Figure 4 disaggregates that total into energy types. Electricity accounts for the largest share of the energy burden in each state.
Energy Costs versus Energy Burden
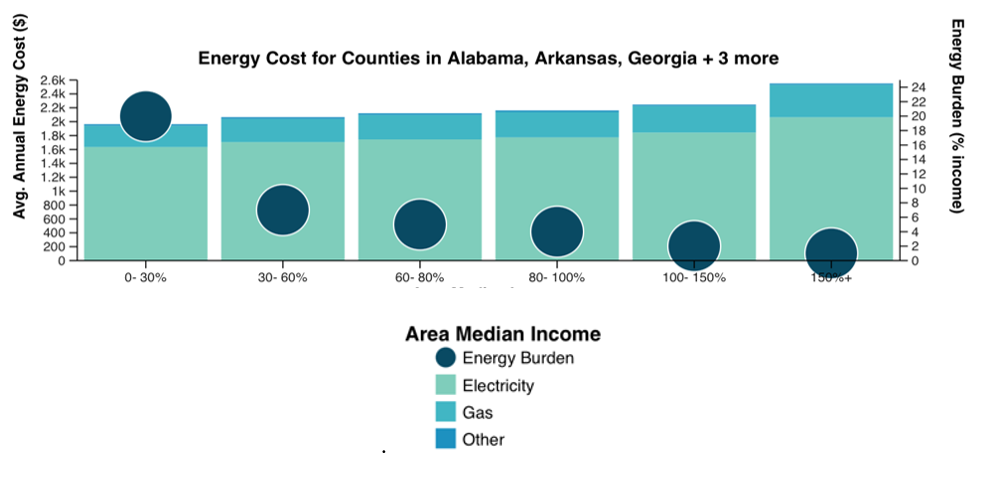
This next section examines actual energy costs and their relationship to both energy burden and income. Figure 5 below shows how energy costs and energy burden vary by income. Across all six states, average annual energy costs rise modestly with income, likely reflecting larger homes and higher overall energy use among higher-income households. Electricity accounts for the largest share of energy spending across all income levels.
Energy burden, however, follows a very different pattern. Households earning less than 30 percent of the area median income face the highest burdens, often spending roughly one-fifth to one-quarter of their income on energy, even though their actual energy cost, and therefore use, is lower than that of higher-income households. As income increases, energy burden declines sharply, even though total energy spending rises. As such, this indicates that, in the region, lower-income households may have lower energy costs and consumption than higher-income households, but those costs impose a greater burden on their finances.
Figure 5. Household Energy Burden and Costs Across Income Levels
Building Economic Stability Through Energy Affordability
Taken together, these data indicate that a high energy burden is a defining feature of economic hardship across the Deep South, particularly among the lowest-income households. Across HOPE’s footprint, many households struggle to afford basic energy services, including maintaining electricity service, cooling homes during extreme heat, and staying warm in winter. Energy burden is not peripheral to daily life in this region. It is a structural constraint that shapes health outcomes, housing stability, and the ability to build financial security. These costs divert funds from savings, education, home repairs, and local spending, weakening household resilience and slowing economic mobility. By directing capital, programs, and place-based strategies to reduce energy burdens, the region can stabilize households, protect vulnerable communities, and create the conditions for long-term economic growth and shared prosperity.
[1] Jessel S, Sawyer S and Hernández D (2019) Energy, Poverty, and Health in Climate Change: A Comprehensive Review of an Emerging Literature. Public Health 7:357.
[2] Chun, J.; Ortiz, D.; Jin, B.; Kulkarni, N.; Hart, S.; Knox-Hayes, J. Energy Burden in the
United States: An Analysis Using Decision Trees. Energies 2025, 18, 646.
[3] The LEAD Tool draws on the U.S. Census Bureau’s American Community Survey 5-Year Estimates for 2018-2022.
[4] https://www.energy.gov/scep/slsc/lead-tool
[5] Institute (TEPRI), Southeast Energy Efficiency Alliance (SEEA) & Texas Energy Poverty Research. 2021. “Energy Insecurity in the South.” ArcGIS StoryMaps. May 21, 2021. https://storymaps.arcgis.com/stories/4377299f586a493984222bfc6ee84e60.
[6] Hirst, Eric, and Marilyn Brown. 1990. “Closing the Efficiency Gap: Barriers to the Efficient Use of Energy.” Resources, Conservation and Recycling 3 (4): 267–81. https://doi.org/10.1016/0921-3449(90)90023-w.
[7] Drehobl, Ariel, Lauren Ross, and Roxana Ayala. 2020. “An Assessment of National and Metropolitan Energy Burden across the United States SEPTEMBER 2020 How High Are Household Energy Burdens?” https://www.aceee.org/sites/default/files/pdfs/u2006.pdf.
[8] Freed, Molly. “1 in 7 Families Live in Energy Poverty. States Can Ease That Burden.” RMI, 18 Dec. 2023, rmi.org/1-in-7-families-live-in-energy-poverty-states-can-ease-that-burden.
[9] In the LEAD Tool, “Other” includes residential fuels such as propane, fuel oil, kerosene, wood, coal, and other delivered heating fuels that are not electricity or natural gas.
Share this article.


