


Homeownership has long been a cornerstone of thriving neighborhoods. Homeownership offers financial stability and is the single largest pathway to building wealth for most families. Yet today, owning a home is increasingly out of reach for many households, especially for communities of color. Rising housing costs, stagnant wages, limited access to affordable credit, and the lingering effects of decades of housing discrimination have made the path to homeownership steeper and more unequal. These challenges are particularly stark in the Deep South, where systemic barriers continue to widen the gap between Black and white households.
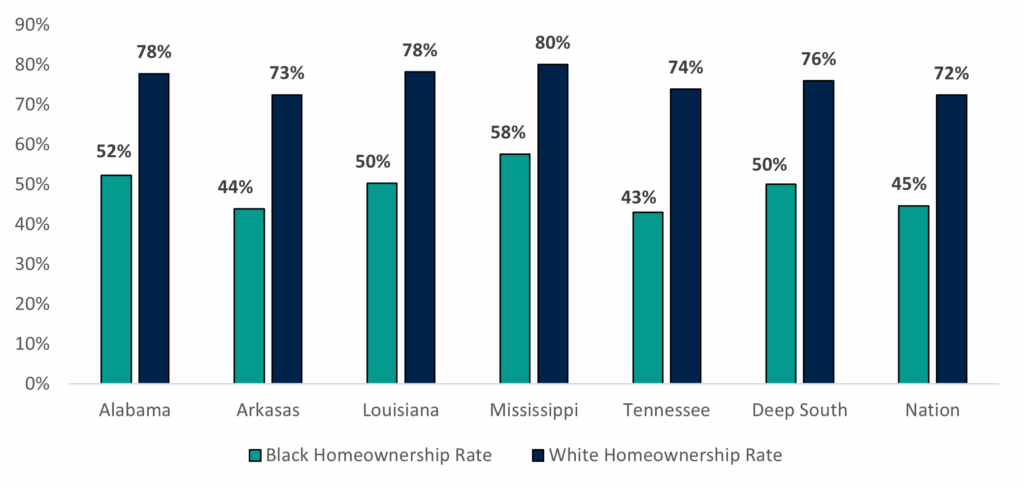
While a critical solution for closing the racial wealth gap, Black homeownership significantly lags behind white homeownership due to historic patterns of discrimination and exclusion in housing opportunities. Over three-quarters (76%) of white households in the Deep South are homeowners while half (50.1%) of Black households are homeowners. This disparity persists for each state within the Deep South (Figure 1).
Figure 1: Homeownership Rates by Race and Geography
Black homeownership trails behind white homeownership in every Deep South State
The homeownership gap is complex, and there are several points throughout the life-span of a home loan where systemic inequities should be addressed. Some of these disparities show up during the initial home purchase process such as lack of equitable access to credit. Other structural barriers, can make it more difficult for a homeowner to keep their home and build the type of equity that grows generational wealth.
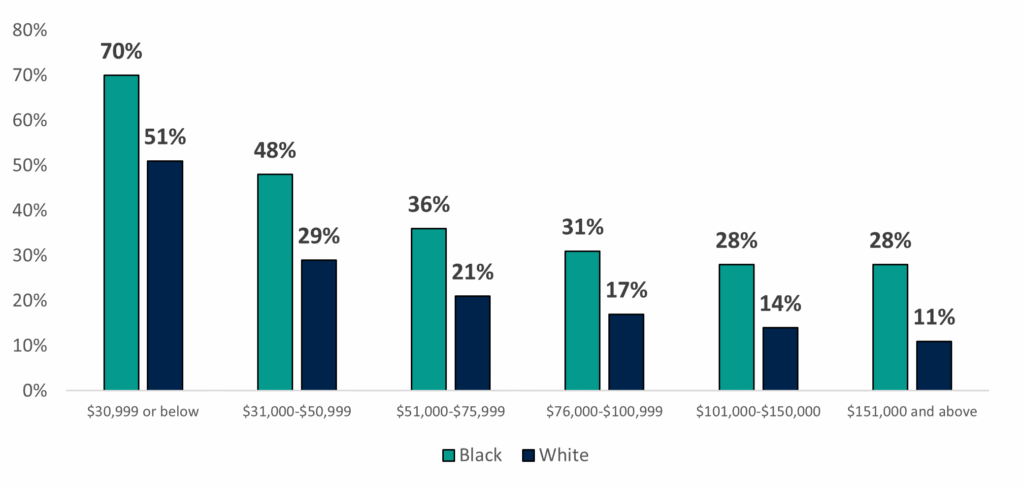
An analysis of mortgage loan denial rates illustrates the failure of financial institutions to ensure equitable access to credit and fair housing. In 2023, the percent of loan originations for Black borrowers in Deep South states was 11.5%, which at half significantly trails the 23% percent of Black residents represented in the population.1 The denial rate for Black borrowers in the Deep South earning more than $150,000 was almost equal to that for white borrowers earning between $31-$50,000. The denial rates for Black borrowers are twice as high than white borrowers at higher income levels e.g., $101,000 or more. In fact, denial rates were higher for black borrowers than white borrowers at every income level. (Figure 2)
Figure 2: Mortgage Denial Rates in the Deep South by Race an Income
Black borrowers are 2x as likely to be denied for mortgage than white applicants at higher income levels
While these structural barriers persist, they are possible to overcome. HOPE has established lending policies that have improved access to credit for borrowers of color and women. Over the last decade, HOPE’s mortgage portfolio more than quadrupled from about $34 million in 2010 to $166 million at the end of 2024, and the percent of mortgage loans originated for borrowers of color grew from 55% in 2007 to a peak of 90% in 2023.
To do this, HOPE designed an in-house mortgage product, the Affordable Housing Program (AHP), to address many of the structural impediments created by the mortgage market. The AHP is one of the single most effective tools available to HOPE to build wealth in the Black community. Through the AHP, mortgages are manually underwritten, and nontraditional indicators of credit repayment history are considered. The product also discounts deferred student debt, does not require mortgage insurance, and accepts credit scores as low as 580. The credit score is of significance. Borrowers in rural areas are much less likely to have the credit scores typically required from banks to qualify for affordable mortgages than their counterparts in urban areas.2 Also, of critical importance, the AHP allows for a loan-to-value (LTV) of 100% – eliminating down payment barriers as many low-wage earners have the cash flow for a monthly mortgage payment, but lack the ability to save for a down payment.
As federal policies contributed to the development of the homeownership gap and racial wealth gap, policy changes can also provide solutions for closing those gaps. One such policy is increasing support for Community Development Finance Institutions and Minority Depository Institutions like HOPE that have a strong track record in providing mortgages to the underserved communities and that are located in these communities.
Footnotes
- Hope Policy Institute analysis of data from the U.S. Census Bureau and Home Mortgage Disclosure Act data ↩︎
- Consumer Financial Protection Bureau. (2022). “Data Spotlight: Challenges in Rural Banking Access”. https://files.consumerfinance.gov/f/documents/cfpb_data-spotlight_challenges-in-rural-banking_2022-04.pdf ↩︎